 This application uses only the capabilities built into an HTML5 compliant
browser to render fractal images, making use of JavaScript and the Canvas rendering area. NOT RECOMMENDED FOR MOBILE
This application uses only the capabilities built into an HTML5 compliant
browser to render fractal images, making use of JavaScript and the Canvas rendering area. NOT RECOMMENDED FOR MOBILE
What is a fractal?
Julia Set
Mandelbrot Set
Newton's Method
Verified In
 Opera
Opera
 Chrome
 Firefox
 IE9
IE9
A derivative work worth checking out
A user took my design and ran with it. It turned out great. Check out the Zoomable Julia Set in HCL color space here. Not only is the color space both striking and visually appealing, a full screen mode is also implemented. There were also some significant improvements made in the performance of my original code. Check it out! It's really well done.
Also available as a Windows application.
Download here. A faster version for your home PC (Windows XP and better) written in C# requires .NET4. This version allows a resizeable rendering area for drawing bigger fractal images and also allows custom Julia sets. The same license and terms of use applies.
If you'd like to have a look at the C# code (a VisualStudio2010 project) you can explore it here.
What is a fractal?
Fractals are mathematical shapes that exhibit complex structure at arbitrarily small scales, meaning that you can "zoom in" on them again and again and they never seem to reduce to a simpler shape. Fractals exhibit a property called self-similarity which means that as you zoom in on them you will see the same patterns again and again. It's as if the original image is made up of smaller copies of itself and those smaller copies are again made up of even smaller copies, and so on. The most impressive thing about fractals is that they derive their amazing complexity from very simple mathematical rules.
The Complex Plane
The only thing difficult about rendering fractals is understanding the mathematical concept of the imaginary number i. In mathematics i is equal to the square root of negative one. Everyone is familiar with the square root of positive numbers like 4 or 9. (2)(2) = 4, and (3)(3) = 9. Mathematicians have simply defined a number i, such that:
(i)(i) = -1.
All numbers can be thought of as having a real part and an imaginary part. Numbers expressed in terms of their real part and their imaginary part are written like this: (A + Bi). A represents the real part and B represents the imaginary part. Numbers represented in terms of their real and imaginary components are called "complex numbers", even though they aren't that complex.
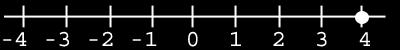 Everyone is familiar with the traditional number line which represents the real numbers. These real numbers are actually complex numbers whose imaginary component is zero.
In other words, you could write the number 4 as a complex number:(4 + 0i). Its real component is 4, and its imaginary component is 0. If a complex number has a nonzero imaginary component, it couldn't be plotted on the one-dimensional number line. Adding another axis, a vertical one, to the number line allows us to represent numbers that have both a complex component and a real component.
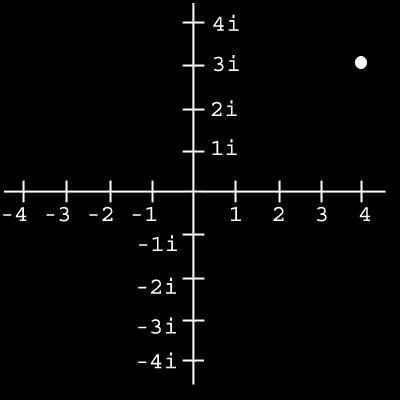 This is known as the complex plane. Shown here is the complex number (4 + 3i). Complex numbers are often represented by the letter Z. In other words, Z = (A + Bi). This is just a shorthand notation to make formulas easier to read.
When adding two complex numbers together, you sum the real parts and the imaginary parts individually:
Z1 + Z2 = (A1 + A2) + (B1 + B2)i.
Whenever you do a mathematical operation on two complex numbers you must usually simplify the final result as a real component and an imaginary component if you intend to keep working with it, or plot it.
When multiplying two complex numbers you have to apply a little algebra.
( Z1 )( Z2 ) = (A1 + iB1)( A2 + iB2 )
=
(A1A2) + i(A1B2) + i(B1A2) + (B1B2)(i)(i)
=
(A1A2 - B1B2) + i(A1B2 + B1A2)
You remembered that (i)(i)=-1 right? Dividing two complex numbers is a similar exercise in algebra that I won't go through here. Complex numbers are not difficult to work with, but you will see that when you apply some fairly simple rules to the complex plane you can end up with wonderfully rich geometric shapes known as fractals.
Iterative Computations
Common to all the fractals explored in this program is the concept of iteration. Iteration means you start with a certain value, perform a calculation on that value and end up with a new value. You then take that new value and apply the same calculation to it and end up with yet another value. Then you take that new value and do the same thing again, and so on and so forth.
This form of feedback, taking the output of an equation and using it as input back into itself, produces a convergence, a divergence, or neither. After a certain number of iterations the value may start converging on a final value or it may be exploding off toward infinity. Or, it may be bouncing around merrily, refusing to converge or diverge.
Fractals are rendered by taking every point in a chosen region of the complex plane and performing an iterative computation on them. If the point converges or diverges it is given a color based on how many iterations it took to converge or diverge. If the point is still unstable after a chosen number of iterations it is colored black.
When you zoom in on a fractal image, which you do in this program by dragging out a window with your mouse, what you are actually doing is examining a smaller region of the complex plane. Each time you zoom in, you are seeing a smaller and smaller portion of the plane -- but the fractal never seems to reduce to a simple image. It's tempting to think that a complex formula is needed to produce this kind of behavior, but you will see that the opposite is true.
The Julia Set
The initial region of the complex plane being examined for the Julia sets in this program resides between -1.7 and +1.7 on the real axis and -1 and +1 on the imaginary axis. The Julia set is rendered by applying the following iteration to every point in the plane:

that is
Znext = (Zcurrent)(Zcurrent) + C
Where the initial value of Z is the point on the complex plane being examined and C is a complex constant. There are many interesting Julia sets using this iteration, differing only in the value they use for C. The first Julia set, sometimes called the Dragon Set, uses C = (-0.8 + 0.156i). The second Julia set uses C = (-0.4 + 0.6i).
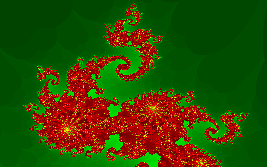 If the point being examined starts diverging off toward infinity it is assigned a color based on how many iterations it took to determine that it was diverging.
The points which diverge almost instantly are colored blue. The points which diverge quickly are green, and the shades of red are reserved for the points which require the most iterations to diverge. The yellow points have not diverged after as many as 2000 iterations.
back to top
The Mandelbrot Set
The initial region of the complex plane being examined for the Mandelbrot set in this program resides between -2.1 and +0.75 on the real axis and -1.2 and +1.2 on the imaginary axis. The Mandelbrot set is rendered by applying the same iteration as the Julia set to every point in the plane:
that is
Znext = (Zcurrent)(Zcurrent) + C
You will want to use the "more iterations" button as you zoom in to refine your image and bring out the most detail.
back to top
Newton's Method
The image generated by this program was created using the equation

The roots of this equation, the values for which the statement is true, are +1, -1, +i, and -i. Although this equation can be solved simply by looking at it, most cannot. Isaac Newton developed a computational method for finding the roots of equations using iteration and a little calculus. Newton's Method allows you to pick any starting value, apply an iteration, and the results of the iteration will converge on one of the solutions.
Newton's Method is extremely efficient and converges rapidly towards a root of the equation, especially when the starting value is close to one of the roots. However, when the starting value for the iteration lies in certain regions between roots the results are not so straightforward. These regions are actually quite complex and unpredictable.
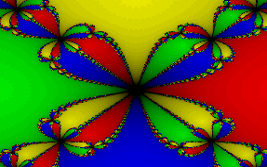 To generate the image for our equation we examine every point in the complex plane between -2 and 2 on the real axis and -2i and 2i on the imaginary axis. We apply Newton's Method to each point in this plane and assign it a color based on the root that the iteration ultimately converges on. Our equation has four roots, so we use four colors: green, red, blue, and yellow. The fewer iterations needed, the lighter the shade.
Like other fractals, you can zoom in on these interesting regions again and again and they never get any simpler. As you zoom in on the darker regions you may need to click your "more iterations" button to restore the image's brightness. This will, of course, slow down the rendering as you get deeper and deeper into the image.
The iteration used in Newton's Method requires some trivial differential calculus. The formula for the iteration is:
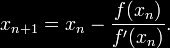
The initial value for x is the point in the complex plane being examined, and the result is fed back into the iteration. f(x) is our equation x^4 - 1. And f'(x) is the first derivative of our equation: 4x^3. Keep in mind that the numbers being used for x are complex numbers of the form (A + Bi), which makes for some messy algebra to get the iteration simplified. For the interested, there are more comments in the Newton.js file in the "iterate" method.
back to top
JavaScript Source Code
The JavaScript used in this program has not been obfuscated in any way. All source code is open license, reuse freely for any purpose. Please cite DougX.net. Questions or comments? Email contact@dougx.net.